Agent Traces & OpenTelemetry
Part 5 / Observability & OperationsWhy standard monitoring doesn’t work
Traditional application monitoring tracks HTTP requests and responses, database queries, error rates, and latency. These metrics tell you whether your application is healthy. They don’t tell you whether your agent is doing the right thing.
Agent systems need to track fundamentally different signals. Decisions - why did the agent choose this action over alternatives? Tool calls - what tools were called, with what arguments, and what was returned? Permission checks - what was allowed and denied, and did the agent attempt anything it shouldn’t have? Token usage - how many tokens were consumed at each step, and is the context window growing faster than expected? Cost - how much did this session cost, and is it within budget? Context - what information was in the context window when the agent made each decision?
Standard monitoring tools don’t capture these semantics because they were designed for deterministic systems. An HTTP request either succeeds or fails. An agent action exists on a spectrum - it might succeed technically (the code compiles) but fail semantically (the code doesn’t do what was intended). Capturing this requires agent-specific instrumentation that understands the difference between “the tool call returned a 200” and “the tool call returned useful information that advanced the task.”
The consequence of inadequate monitoring is that when agents fail, teams ask “what happened?” and have no good answer. They can see that the agent made 47 tool calls over 12 minutes and consumed 350K tokens, but they can’t reconstruct the reasoning chain that led to the failure. Without proper tracing, debugging agent failures is like debugging a distributed system with only access logs - you can see what happened, but not why.
OpenTelemetry for agents
OpenTelemetry (OTel) is the industry standard for application observability - traces, metrics, and logs. It’s maintained by the CNCF, supported by every major cloud provider, and used by millions of applications. Extending OTel to cover agent-specific semantics is the natural path forward because it lets teams integrate agent observability into their existing monitoring infrastructure rather than building a separate system.
The OTel community is actively developing semantic conventions for AI workloads - standardized attribute names and span types that ensure consistency across different agent frameworks and observability backends. These conventions are still evolving, but the core concepts are stable enough for production use.
The key concepts map naturally:
| OTel Concept | Agent Equivalent |
|---|---|
| Trace | Complete agent session (task start to completion) |
| Span | Individual agent action (tool call, LLM request, decision) |
| Attributes | Agent-specific metadata (tokens, cost, model, tool name) |
| Events | Significant moments (permission denied, human approval, error) |
| Links | Connections between agent sessions (delegation, escalation) |
Instrumenting an agent
Instrumenting an agent means wrapping every significant action - LLM calls, tool calls, permission checks, and decision points - in OpenTelemetry spans. Each span captures the action type, duration, input/output size, cost, and outcome. The spans are nested to reflect the agent’s decision hierarchy: a session span contains loop iteration spans, which contain tool call spans, which contain individual API call spans.
The most important instrumentation point is the LLM call. Every call to the model should log the model name, input token count, output token count, latency, cost, and whether the response included a tool call or a final answer. This data is essential for cost tracking, performance optimization, and debugging. Without it, you’re flying blind.
The second most important instrumentation point is the tool call. Every tool call should log the tool name, the arguments (sanitized to remove sensitive data), the response size, the latency, and whether the call succeeded or failed. Tool call patterns reveal a lot about agent behavior - an agent that calls the same tool repeatedly with slightly different arguments is probably confused. An agent that calls tools in an unexpected order may have misunderstood the task.
Trace visualization
A well-instrumented agent session produces a trace that reads like a story. The top-level span shows the complete session - task description, total duration, total cost, and outcome. Nested within it are the loop iterations, each showing what the agent decided to do and why. Within each iteration are the individual tool calls and LLM requests, with their timing, cost, and results.
Good trace visualization tools (Jaeger, Grafana Tempo, Langfuse) let you click through this hierarchy, seeing exactly what the agent was thinking at each step. This is invaluable for debugging - when an agent produces bad output, you can trace back through its decisions to find the point where it went wrong.
Agent session replay
Beyond tracing, session replay lets you reconstruct exactly what an agent did - not just the actions it took, but the full context it had when it made each decision. Session replay captures the complete context window at each step, including the system prompt, conversation history, retrieved context, and tool results. This is expensive in storage (a single session might generate megabytes of replay data) but invaluable for debugging complex failures.
The practical approach is to enable full session replay for a sample of sessions (1-5%) and enable it automatically for any session that triggers an alert or exceeds cost thresholds. This gives you detailed debugging data for the sessions that matter without the storage cost of recording everything.
Trace-Based debugging
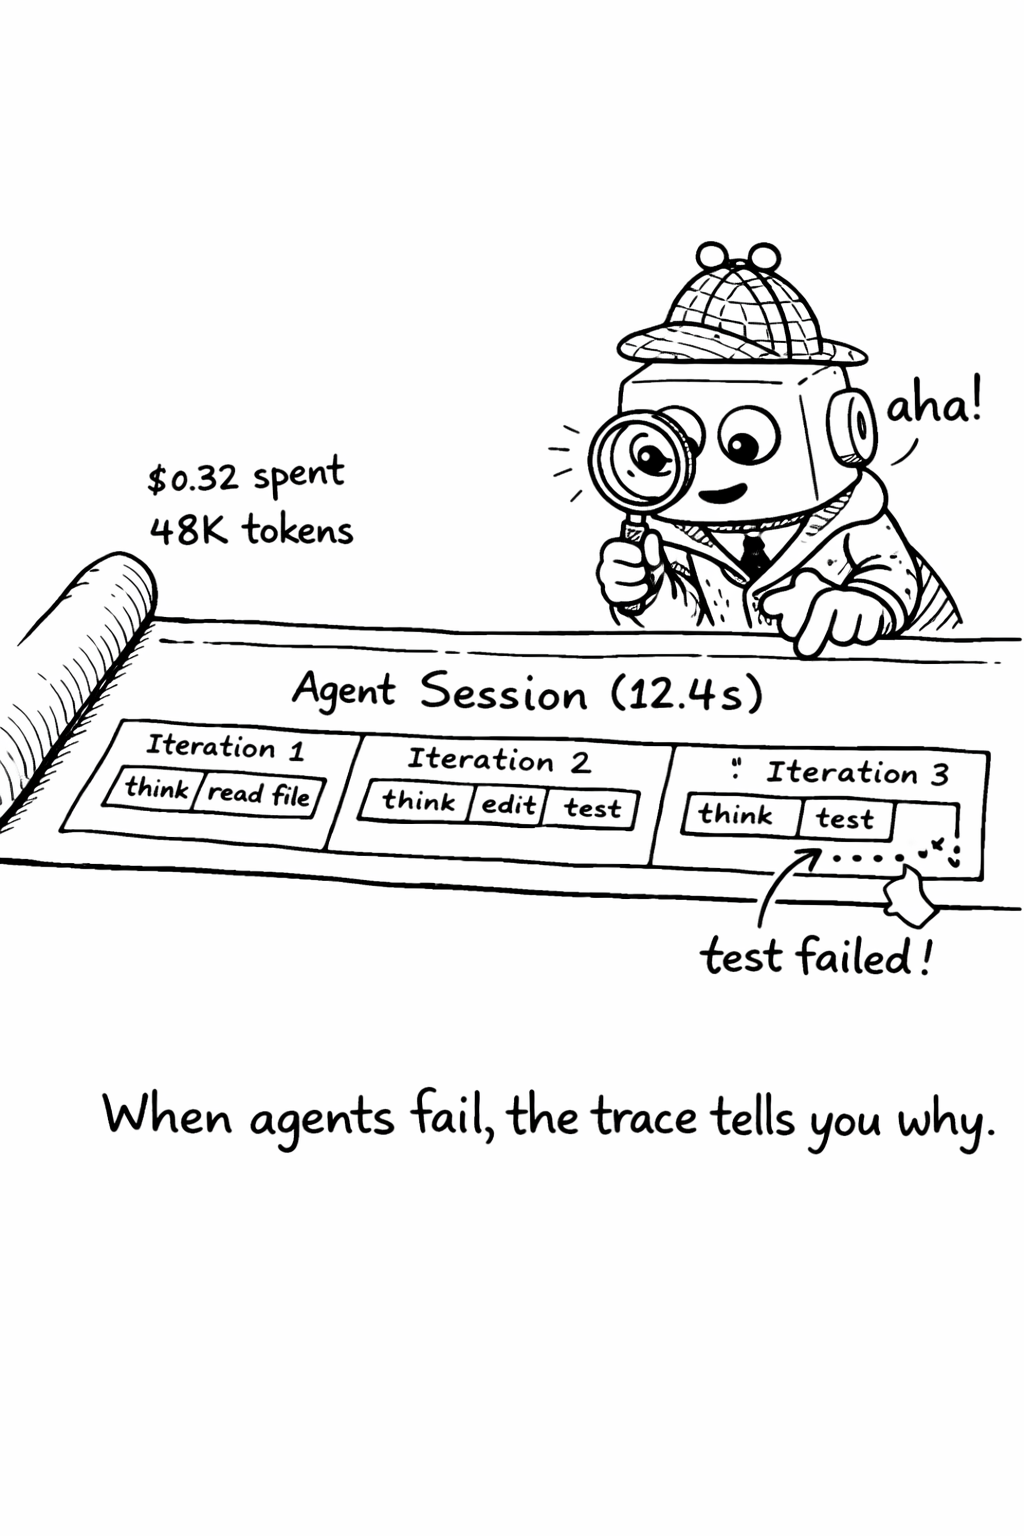
The most practical application of agent tracing is debugging. When an agent produces bad output, the trace tells you why.
First, find the trace using the session ID or task ID. The trace shows the complete sequence of actions the agent took. Second, identify the divergence point - walk through the trace from the beginning, comparing the agent’s actions to what you would have done. At some point, the agent made a decision that diverged from the correct path. Third, understand why by examining the context the agent had at the divergence point. The divergence is almost always caused by missing context (the agent didn’t have the information it needed), misleading context (the agent had incorrect or outdated information), or ambiguous instructions (the agent interpreted the task differently than you intended). Fourth, fix the root cause - update AGENTS.md, fix the retrieval pipeline, or clarify the task specification template.
This debugging workflow is systematic and repeatable. Over time, it produces a feedback loop that continuously improves agent output quality
- each debugging session identifies a root cause, each root cause fix prevents future failures.
Step-by-step: Setting up agent tracing
- Install OpenTelemetry SDK and configure the exporter (Jaeger, Grafana Tempo, or Langfuse)
- Wrap your agent loop with the
AgentTracerclass above - every session gets a trace - Add span attributes for model, token count, cost, and tool calls
- Set up alerts for sessions exceeding cost or duration thresholds
- Create a dashboard showing: sessions/day, avg cost/session, error rate, top tool calls
- Review traces weekly - look for patterns in failures and optimize context engineering
Checklist: - [ ] Every agent session has a unique trace ID - [ ] Every LLM call logs model, tokens, and latency - [ ] Every tool call logs name, duration, and success/failure - [ ] Traces are searchable by session ID, user, and task type - [ ] Alerts fire when cost exceeds $5/session or duration exceeds 10 minutes
Choosing an observability backend
The observability backend you choose determines what questions you can answer about your agent system. The options range from general-purpose (OpenTelemetry with Jaeger or Grafana Tempo) to AI-specific (Langfuse, Arize Phoenix, LangSmith).
General-purpose backends (Jaeger, Grafana Tempo, Datadog) are the right choice if you already have an observability stack and want to integrate agent traces into your existing dashboards. They support OpenTelemetry natively, which means you can correlate agent traces with application traces - seeing how an agent’s actions affect your production systems. The downside is that they don’t have AI-specific features like prompt versioning, eval integration, or cost tracking.
AI-specific backends (Langfuse, Arize Phoenix, LangSmith, Braintrust) are purpose-built for AI workloads. They understand the semantics of LLM calls - they can display prompt/completion pairs, track token usage and cost, compare prompt versions, and integrate with eval pipelines. The downside is that they’re a separate system from your existing observability stack, which means you need to maintain two dashboards and can’t easily correlate agent traces with application traces.
The hybrid approach uses OpenTelemetry for trace collection and exports to both a general-purpose backend (for correlation with application traces) and an AI-specific backend (for AI-specific analysis). This gives you the best of both worlds but adds complexity. For most teams, starting with an AI-specific backend and adding general-purpose integration later is the pragmatic choice.
Agent observability anti-patterns
Several anti-patterns emerge repeatedly in agent observability implementations.
Logging everything seems like a good idea but creates a data management problem. A single agent session can generate megabytes of trace data. At 200 sessions per day, that’s gigabytes per week. Most of this data is never looked at. Instead, log at the right granularity - every LLM call and tool call, but not every intermediate token. Enable detailed logging (full context windows, complete tool responses) only for sampled sessions or sessions that trigger alerts.
Ignoring cost attribution means you know your total spend but not what’s driving it. Every trace should include cost data - the cost of each LLM call, the cumulative cost of the session, and the cost per task type. Without cost attribution, you can’t optimize.
Not alerting on anomalies means you discover problems when users complain, not when they happen. Set up alerts for sessions that exceed cost thresholds, sessions that exceed duration thresholds, sessions with unusually high error rates, and sessions that access unexpected resources. These alerts are your early warning system.
Related Concepts: Cost Tracking (15.1), Incident Response (16.1) Related Tools: OpenTelemetry, Langfuse, AgentTrace, Maxim AI